U.S. House Election Data Visualisation Project
US Election/Data Analytics/Data Visualisation/Web Scrapping/Web App with Dash/Beautiful Soup/Selenium
Author: Regan C.H. Yin | Special thanks: Andy Chan, Daniel Lau
An interactive analytics tool that lets users explore the 2022 U.S. House election at state and district levels. It combines robust web scraping (Selenium + BeautifulSoup), data processing (Pandas) and visualisation (Dash + Plotly).
Contents
Executive Summary Tech Stack & Roles Objectives Code Writing Procedure (End-to-End) Final Outcomes Reflections & Next Steps How to Run Locally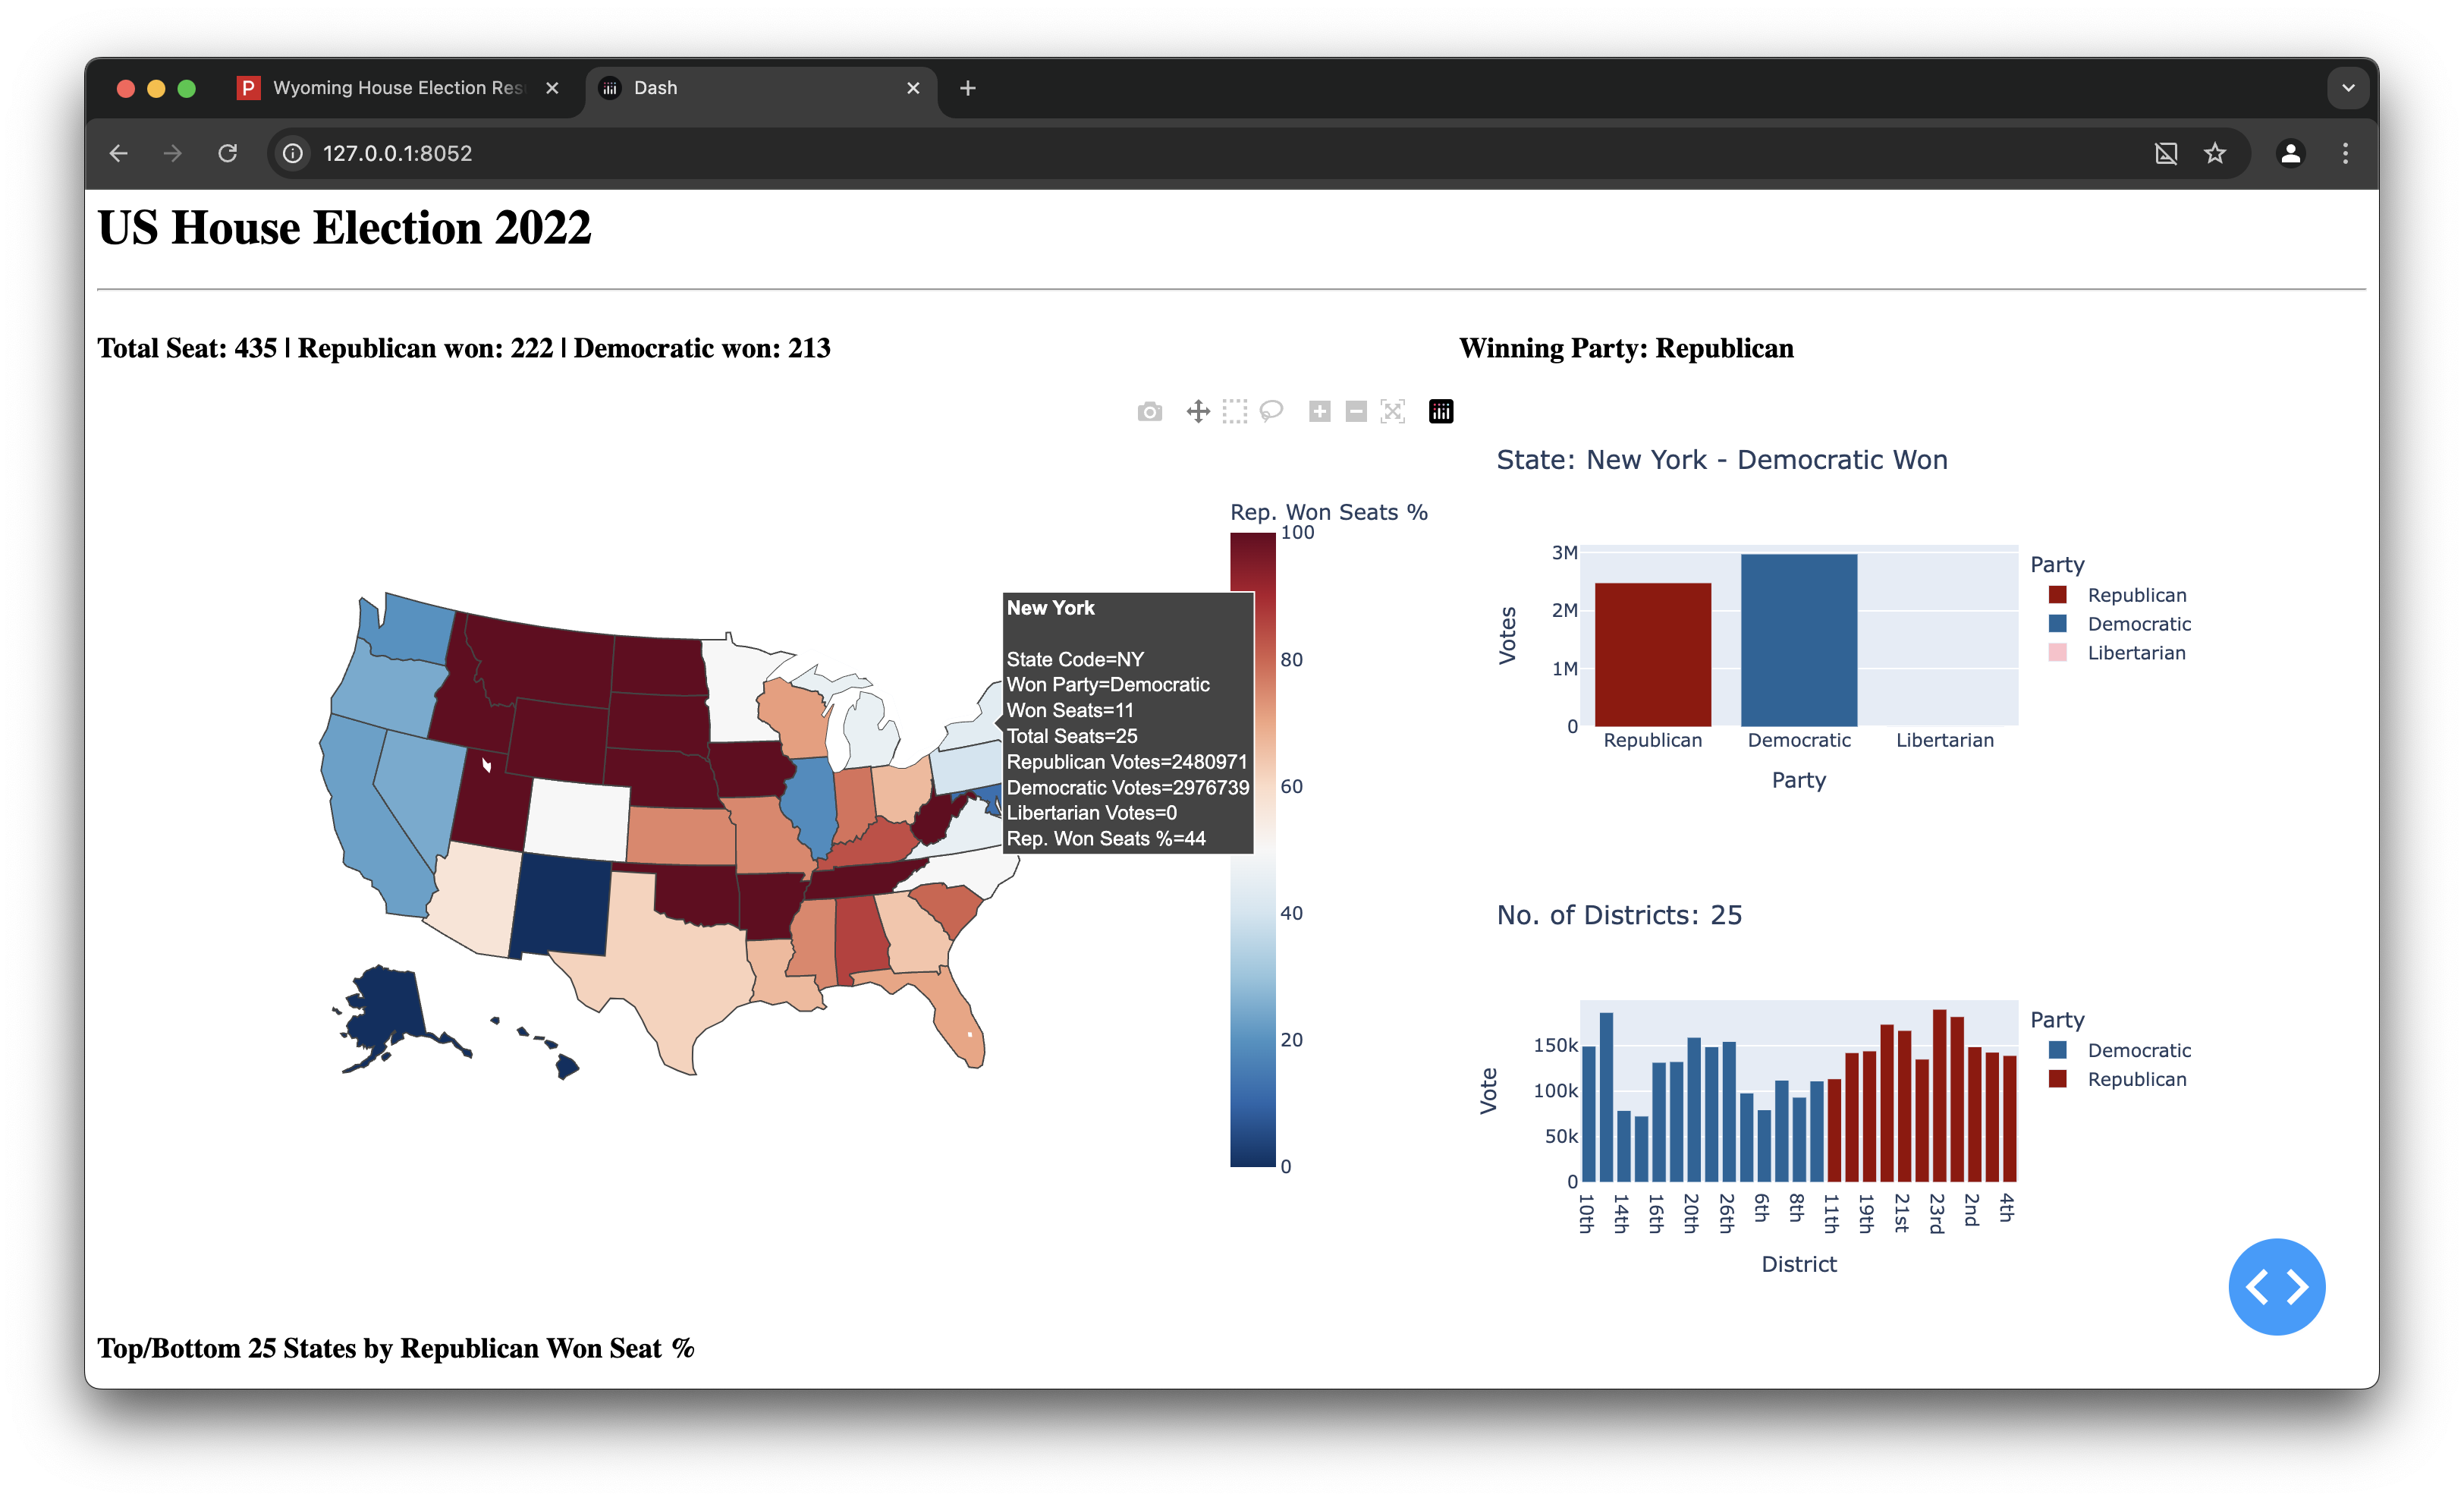
Executive Summary
The project delivers a clean, performant dashboard to compare party performance, vote distributions and district-level winners. It automates data ingestion from public election pages, cleans and aggregates results, then renders them in an intuitive interface suitable for analysts and the general public alike.
Tech Stack & Roles
Python Selenium BeautifulSoup Pandas Dash (JupyterDash) Plotly ExpressEnd-to-end by Regan: scraping, data engineering, visual design, and app integration.
Objectives
- Provide a user-friendly, interactive view of the 2022 U.S. House election.
- Enable state & district-level comparisons of winners and voting patterns.
- Demonstrate a full pipeline: scraping → cleaning → feature engineering → dashboard.
Code Writing Procedure (End-to-End)
Part I — Web Scraping
Libraries: selenium, bs4 (BeautifulSoup), webdriver_manager, pandas.
- Driver setup. Configure Chrome with lightweight options, initialise
webdriver.Chrome(). - State mapping. Define a
state_dictof full state names → USPS codes. - Core function. Implement
get_election_data(driver, state):- Parse page source via BeautifulSoup.
- Handle two layouts: multi-district vs single-district states.
- Extract district, candidate, party, incumbent, votes, percent.
- Normalise party labels (R/D/Ind./Libertarian/Green).
- State enumeration. Visit the index page to collect the 50 state links, then iterate each state’s House page; click “expand” buttons when present to reveal all candidates.
- Tabular output. Convert nested lists →
DataFramewith columns: State, State Code, District, Party, Candidate, Incumbent, Vote, Pct%; persist tohouse.csv.
# sketch of the core scraping pieces
from selenium import webdriver
from bs4 import BeautifulSoup
import pandas as pd

state_dict = {"Alabama":"AL", "Alaska":"AK", ...}

def get_election_data(driver, state):
    soup = BeautifulSoup(driver.page_source, "html.parser")
    result = []
    # handle multi- and single-district layouts, normalise parties & incumbency
    # append rows: [state, state_code, district, party, name, incumbent, votes, pct]
    return result

# build state list from index, loop each state house page, click expand when present
rows = []
for state in state_list:
    driver.get(f"https://www.politico.com/2022-election/results/{state.lower().replace(' ','-')}/house/")
    rows += get_election_data(driver, state)

house = pd.DataFrame(rows, columns=["State","State Code","District","Party","Candidate","Incumbent","Vote","Pct%"])
house.to_csv("house.csv", index=False)
Part II — Data Cleaning & Feature Engineering
- Sanitise numeric fields: remove commas; coerce
Votetoint,Pct%tofloat(0–1). - For each state: compute Total Seats, Total Votes, Won Seats (Republican seat count), party vote sums, and Rep. Won Seats %; infer Won Party.
- Output an aggregated
seat_wontable for the map + summary charts.
import pandas as pd
house = pd.read_csv("house.csv")
house["Vote"] = pd.to_numeric(house["Vote"].str.replace(",",""), errors="coerce").dropna().astype(int)
house["Pct%"] = house["Pct%"].str.rstrip("%").astype(float)/100.0

seat_rows = []
for (state, code), g in house.groupby(["State","State Code"]):
    total_seats = g["District"].nunique()
    total_votes = g["Vote"].sum()
    won_seats = sum(g.groupby("District").apply(lambda x: x.loc[x["Pct%"].idxmax(),"Party"])=="Republican")
    republican_votes = g.loc[g["Party"]=="Republican","Vote"].sum()
    democratic_votes = g.loc[g["Party"]=="Democratic","Vote"].sum()
    libertarian_votes = g.loc[g["Party"].str.contains("Libertarian", na=False),"Vote"].sum()
    seat_rows.append({
        "State":state,"State Code":code,"Total Seats":total_seats,"Total Votes":total_votes,
        "Won Seats":won_seats,"Republican Votes":republican_votes,"Democratic Votes":democratic_votes,
        "Libertarian Votes":libertarian_votes,"Rep. Won Seats %":round(won_seats/total_seats*100,2),
        "Won Party":"Republican" if won_seats > total_seats/2 else "Democratic"
    })
seat_won = pd.DataFrame(seat_rows)
Part III — Dash App (Map + Linked Charts)
- Layout: Title, KPI line (435 seats; R 222 / D 213), USA choropleth (state code), and two right-hand panels: party vote distribution & district winner bars, both responding to map hover.
- Top/Bottom 25: Radio selector renders ranked bar charts for % of Republican seats.
- Callbacks: one for map hover → updates two panels; one for the Top/Bottom toggle.
from jupyter_dash import JupyterDash
from dash import html, dcc, Input, Output
import plotly.express as px

app = JupyterDash(__name__)
app.layout = html.Div([...])  # map + linked charts + toggle

@app.callback(
    [Output("choropleth_map","figure"), Output("bar_chart","figure"), Output("district_bar_chart","figure")],
    Input("choropleth_map","hoverData")
)
def update_panels(hover):
    # build map from seat_won; when hovering a state, slice seat_won & house
    # return: map fig, party vote bar, district winner bar
    ...

@app.callback(Output("top-bottom-25-bar-chart","figure"), Input("toggle-chart","value"))
def update_top_bottom(sel):
    # select nlargest/nsmallest on 'Rep. Won Seats %', render bar chart
    ...
Final Outcomes
- Fully working, interactive dashboard with linked views (map ↔ state & district panels).
- Cleaned dataset (
house.csv) and engineered summary table (seat_won). - Insight surfaces: party dominance by state, competitiveness, and distribution of winners across districts.
Reflections & Next Steps
What went well: Reliable scraping across heterogeneous layouts; concise visual grammar; responsive callbacks.
Challenges: Dynamic pages & sporadic missing party tags required defensive parsing; hover-driven UX needed careful defaults.
Roadmap: Add Senate/Presidential modules; deploy Dash app to a managed host; integrate trendlines and forecasting.
How to Run Locally
- Create and activate a Python 3.10+ environment.
pip install selenium webdriver-manager beautifulsoup4 pandas jupyter-dash dash plotly- Run the scraper to produce
house.csv, then start the Dash app (JupyterDash or pure Dash). - Open the served URL (e.g.,
http://127.0.0.1:805x).